Update - Nov 18, 2023
This solution ended up winning out of 1836 participants!

Predicting league of legends team rankings based on in game data and performance provided by Riot Games and AWS.
This solution was:
- able to correctly include 14/20 teams in the top 20
- able to accurately include 7/8 top teams (Left: Actual, Right: Prediction)
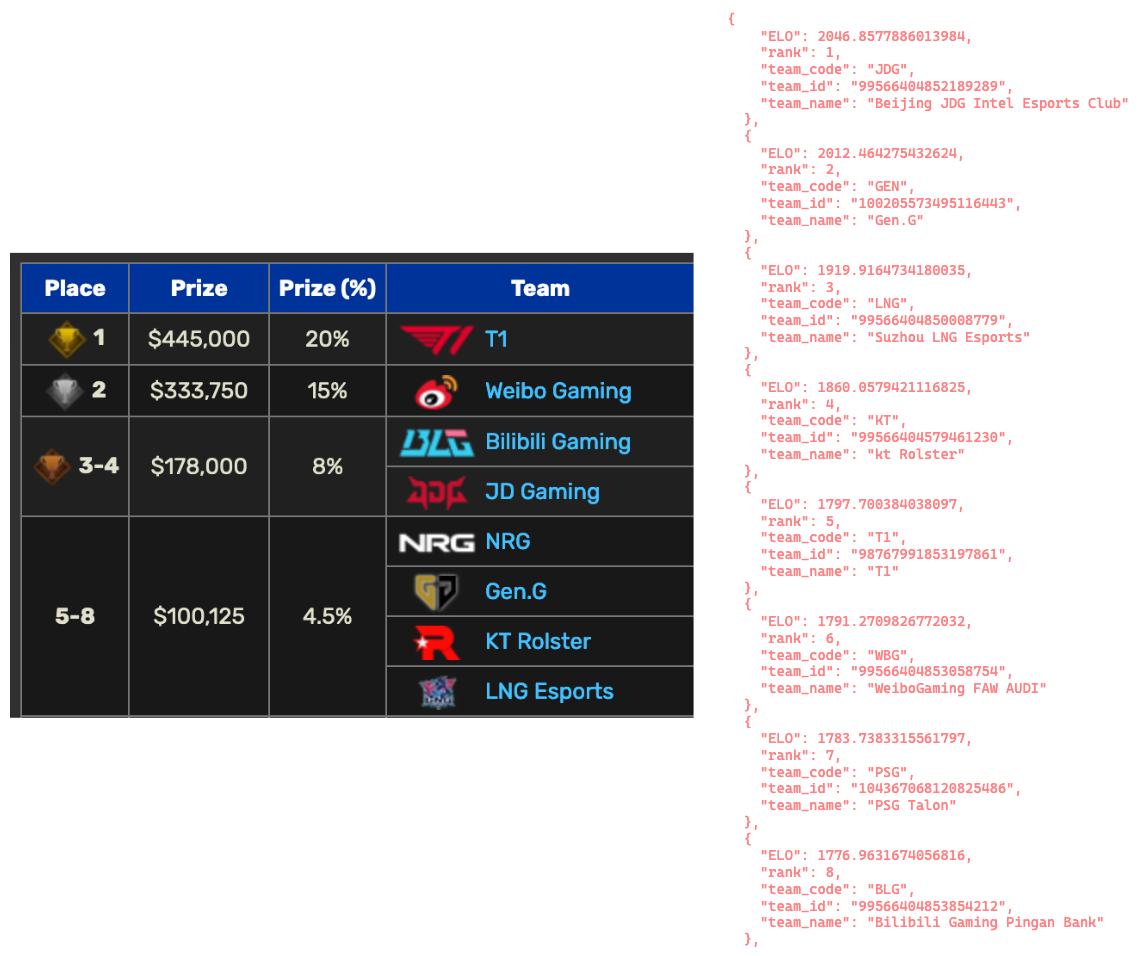
T1 ended up cliching the winning spot in a miraculous and deserving run where every player was able to outshine the rest of the competition.
Inspiration
I still remember my first league ranked game from 10 years ago like it was yesterday. I was duo’ing with a buddy who took the game super casually — we were playing around Silver MMR. Fast forward a few years and I had invested an ungodly amount of hours towards the game, getting out of my comfort zone, and taking the game more seriously.
At my peak, I was Diamond 1.
LoL can be credited as my first forray into thinking and putting effort into analyzing and optimizing my performance for competitive games. Since then, I’ve switched more to Valorant since I’m no longer a huge fan of obnoxious and incessant clicking. My efforts have currently taken me to Immortal 1.
With that said, I’ve always wanted to take a stab at digging into competitive game data to find out KPIs that are relevant to what makes anyone, or any team win more games. The Riot Games hackathon challenge has allowed me to channel my inner LS

What is K-weighted ELO and how does it work?
K-weighted ELO, for lack of a more marketable name, does exactly what it says — gives you team rankings based on custom, weighted K-values!
The Elo rating system is used to rate players in competitive games like chess. It’s based on the principle that the change in a player’s rating after a game is proportional to the difference between the actual outcome and the expected outcome of the game.
The formula is:
ΔR=K(S−E)Where:
    ΔR is the change in rating.
    K is a constant called the K-factor, which determines how much a rating should change after a single game. Different organizations and games might use different K-values, depending on how volatile they want ratings to be.
    S is the actual score of the game (1 for a win, 0.5 for a draw, and 0 for a loss).
    E is the expected score, which is calculated based on the difference between the ratings of the two players.
The K-factor is critical to the Elo system, with a large K-value making ratings more volatile, so players can rise or fall more quickly. A small K-value makes ratings more stable, but it takes longer for a player’s rating to reflect their true skill.
Thus, this is exactly where we start off — determining the base K values.
Time based Base-K value

We obviously have TONS of data, so after gathering them all, I decided to sort all the tournaments based on the date of the first game from tournaments played. This is because tournament dates are a bit off, so the first game-date can be used as the source of truth.
e.g. worlds 2022, where tournament started on 2022-09-27, but first game we have access to wasn’t played until 29th.
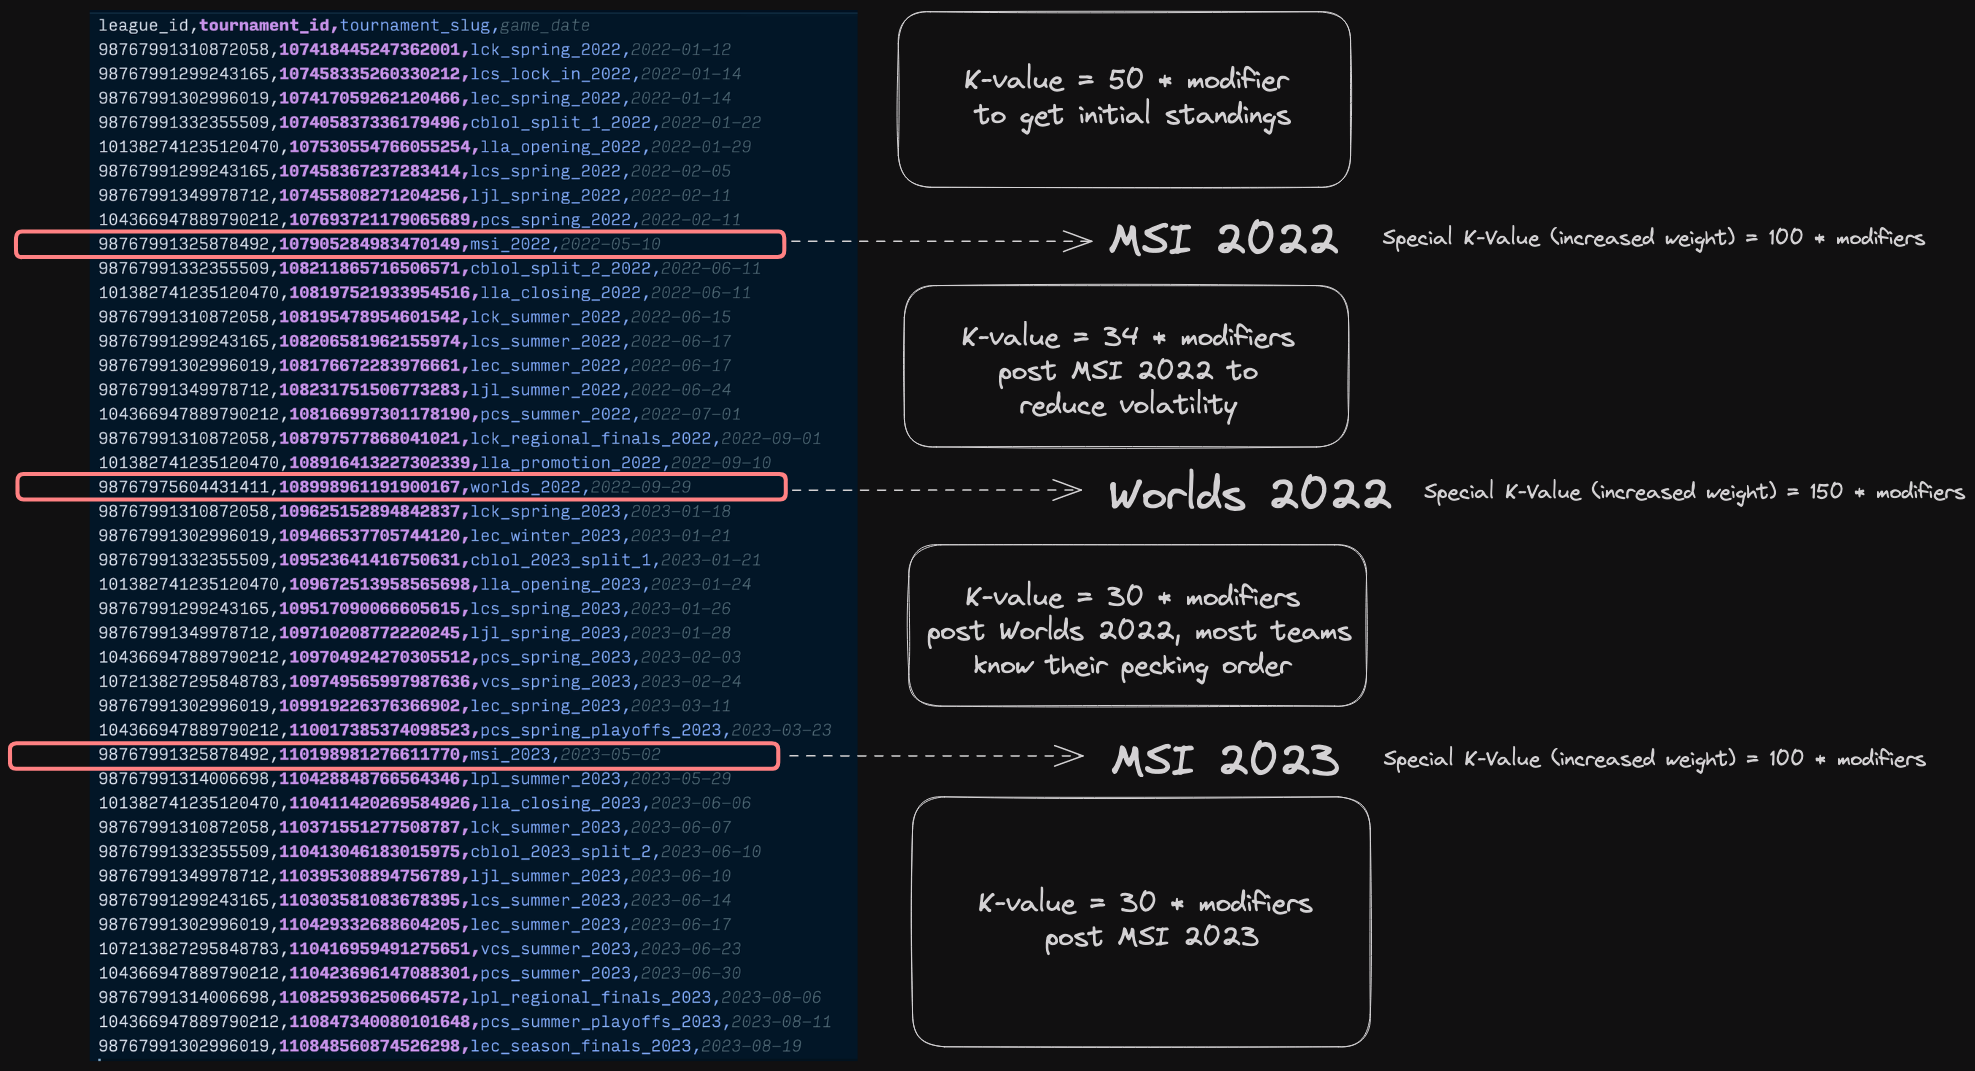
As seen above, we can see the pattern of games starting at spring, heading into MSI soon after, followed by summer league games, and then finally Worlds and winter/spring leagues right after.
Given this repeating pattern, I decided to model my system based on Riot’s earlier implementations of the LoL solo queue rating system where the 10 placement games were pivotal to determining the rank of a player.
It was common for players who went 8-2 or better in their placements to get placed into Plat or high Gold directly. But once placed, the gains stabilize based on ongoing performance.
Similarly, my system treats spring 2022 tournaments as the starting point/placements for all leagues, treating these as the first games its seen, and as a result, uses a high K-value of 50 to start things off and get teams placed
accordingly. The global events are super important, hence, winning at a global level should be rewarded accordingly. Hence, MSI and Worlds events have base K values of 100 and 150, respectively.
The closer we get to the present, aka, the more games our prediction system has seen, the lower the K-value gets — with most recent games being given a K-value of 30.
Modifiers
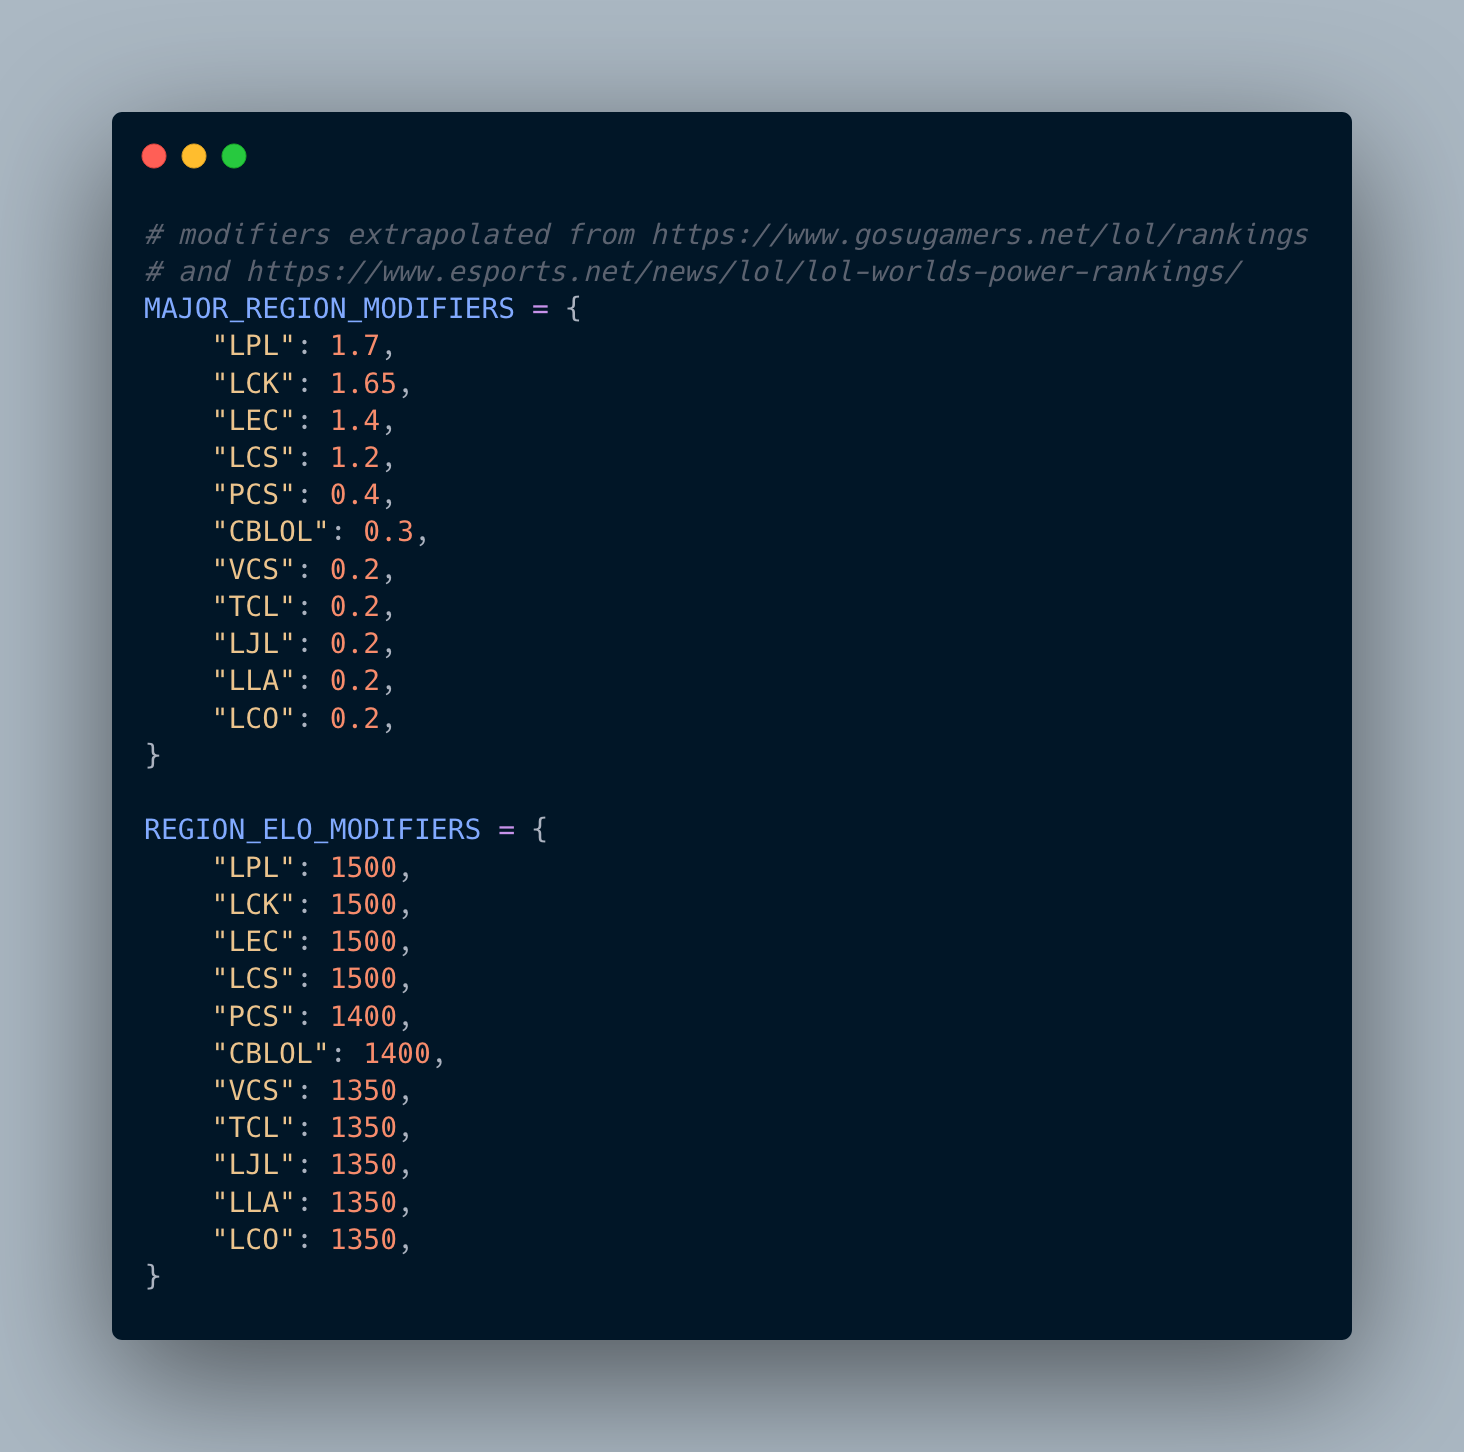
Above, we have MAJOR_REGION_MODIFIERS that are extrapolated from the links mentioned + looking at historical performances of teams from different regions at a global scale. For instance, LPL and LCK teams have
consistently appeared in the top teams at global events with LEC and LCS teams scattered in-between time to time, thus representing modifiers respectively. Lower scores are also given to regions who’ve never had teams
play at global stages or lack strong teams who challenge the status-quo of the aforementioned regions dominating. This also helps in accurately rewarding a team from a weaker region. For instance, a team from LJL beating
a team from LPL would result in a gain factor for the LJL team by 1.7. The losing team is also penalized accordingly!
# Weighted K value based on when game was played
# early 2022 = high K to get initial standings
# as time goes, lower K values + region modifier to add effect
# where a team from a weaker region wins against a stronger region, rewarding them better
k_value = get_k_value(row) * MAJOR_REGION_MODIFIERS[get_team_to_league_mapping()[loser]]
Similarly, the starting ELO for teams at different regions are also adjusted accordingly. This is because the base level at a region like LCK, where the player-base is enormous, cannot be the same as a region like OCE with a much lower player-base. The higher player base attributes to higher variance in skill, higher skill-ceilings, and generally a harder ladder to climb as you are more likely to run into better players on average. For this, I’ve kept the 4 major regions at a level playing field, and tuned the base-elo’s of the rest of the regions accordingly.
Together with the BASE-K value, these modifiers help keep our starting K values in check as we add more weights from features to this value.
Features for K-Value
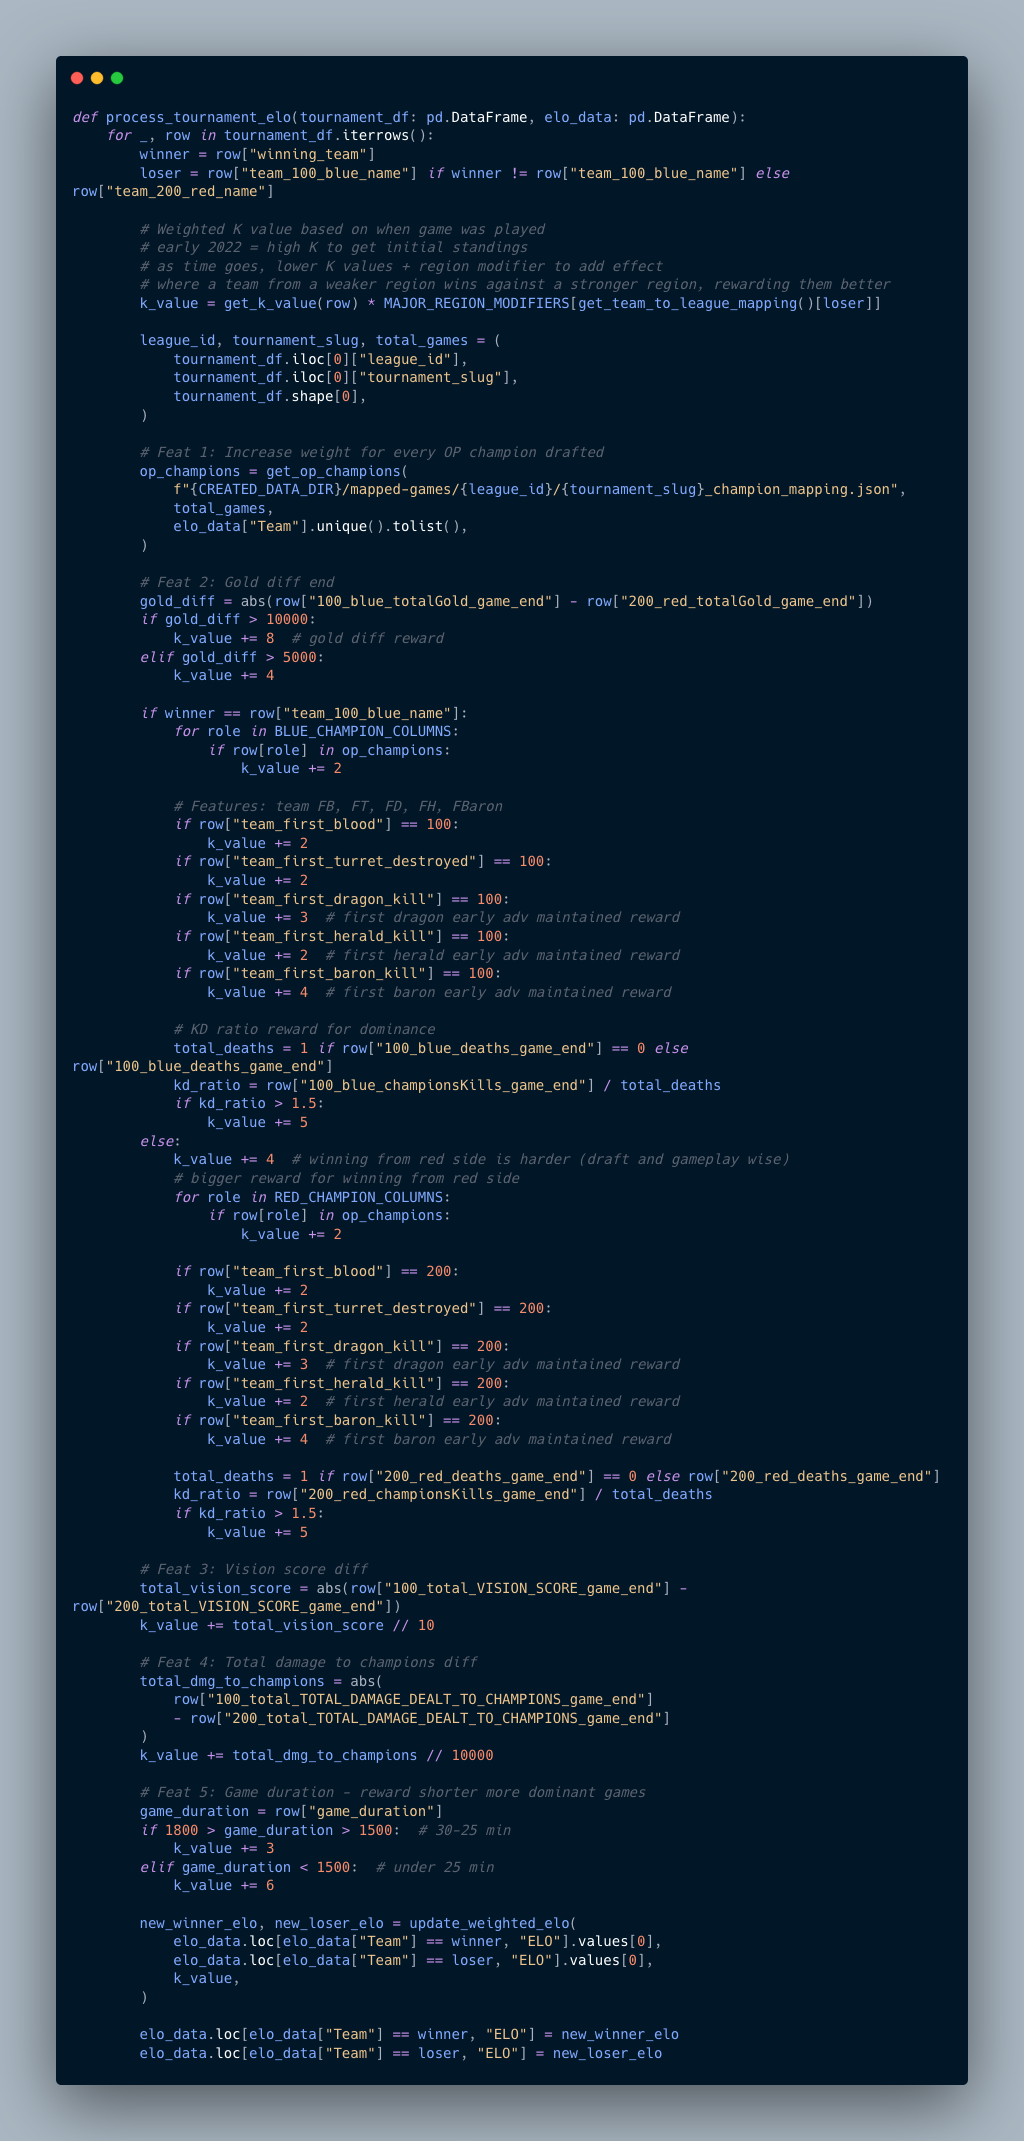
The above function is the meat and potatoes that processes the ELO rating for our teams, per game.
You can find my attempts of EDA and feature gathering w/ fancy visuals within the analysis and going-crazy notebooks.
However, for a quick summary, here are the other features that contribute to the weighted K-value system…
- Draft Success
While gathering data, I also decided to gather champion stats like:
- number of times that champ was played,
- which side they were played on
- what role
- win rate of the champ for that tournament
Sample truncated output for Worlds 2022:
{
  "100": {
    "top": [
      { "Aatrox": 35, "winRate": 68.57142857142857 },
      { "Gnar": 13, "winRate": 61.53846153846154 },
      { "Maokai": 11, "winRate": 27.27272727272727 },
      { "Fiora": 9, "winRate": 55.55555555555556 },
      { "Ornn": 8, "winRate": 25.0 },
      { "Sejuani": 8, "winRate": 62.5 }
    ],
    "sup": [
      { "Leona": 15, "winRate": 26.666666666666668 },
      { "Nami": 14, "winRate": 64.28571428571429 },
      { "Nautilus": 10, "winRate": 10.0 },
      { "Yuumi": 10, "winRate": 90.0 },
      { "Renata": 9, "winRate": 55.55555555555556 },
      { "Amumu": 8, "winRate": 75.0 },
      { "Thresh": 6, "winRate": 66.66666666666666 },
      { "TahmKench": 6, "winRate": 66.66666666666666 }
    ]
  },
  "200": {
    "top": [
      { "Fiora": 15, "winRate": 46.666666666666664 },
      { "Renekton": 12, "winRate": 25.0 },
      { "Gnar": 12, "winRate": 41.66666666666667 },
      { "Ornn": 12, "winRate": 66.66666666666666 },
      { "Aatrox": 11, "winRate": 45.45454545454545 },
      { "Jax": 10, "winRate": 60.0 },
      { "Camille": 7, "winRate": 57.14285714285714 },
      { "Sejuani": 6, "winRate": 16.666666666666664 },
      { "Gragas": 6, "winRate": 83.33333333333334 }
    ]
  }
}
Ref. code
Then, I decided to get all champions deemed OP using the following metrics:
- Pick Rate: Champions that are frequently chosen may indicate that they have a perceived advantage, either due to their abilities or how they fit into the current meta. We set this threshold to 20% of total games in the tournament.
- Win Rate: While a high pick rate might indicate a champion’s perceived strength, the win rate confirms if that strength translates into actual game wins. A champion that is frequently picked but has a low win rate might not be “overpowered.”. The champion should have a win rate of more than 50%.
- Consistency Across Teams: If multiple teams are frequently picking a particular champion, it could indicate that the champion’s strength isn’t just a strategy of a single team but is recognized universally. We check if the champ has been picked by at least 25% of all unique teams partaking in the tournament.
Based on these factors, I’m able to determine if a champion is OP. We use this list of OP champions and check if the winning team was able to grab as many such champions.
Ref. code
For every OP champ grabbed, they are rewarded +2 towards their total K-Value as a sign of drafting successfully towards a win.
- Side Advantage
If you’ve played LoL at a high level, or watched pro-games, you’ll come to know that based on the league meta, particular sides have their advantages.
For instance, in a patch where there’s an OP champion that has no counters or is a top prio pick, blue team gets first draft and thus can instantly pick that champion for an advantage.
The sides should be given some weight also due to map layout differences.
Blue team has:
- an easier access to Baron,
- top side gank paths (tri-brush)
Red team has:
- easier access to dragon
- bot side gank path (tri-brush).
Historically, the top lane gank path for the Blue side has been more advantageous than the gank path for the bot side for Red due to the fact that top-lane only has 1 champion.
There is no one else to help you ward, peel or escape from ganks if the blue team were to abuse this extra power while bot lane supports can at least peel or ward to prevent total abuse. To exemplify this, immobile top-lane champions on the red side have worse win-rates than on the blue-side:
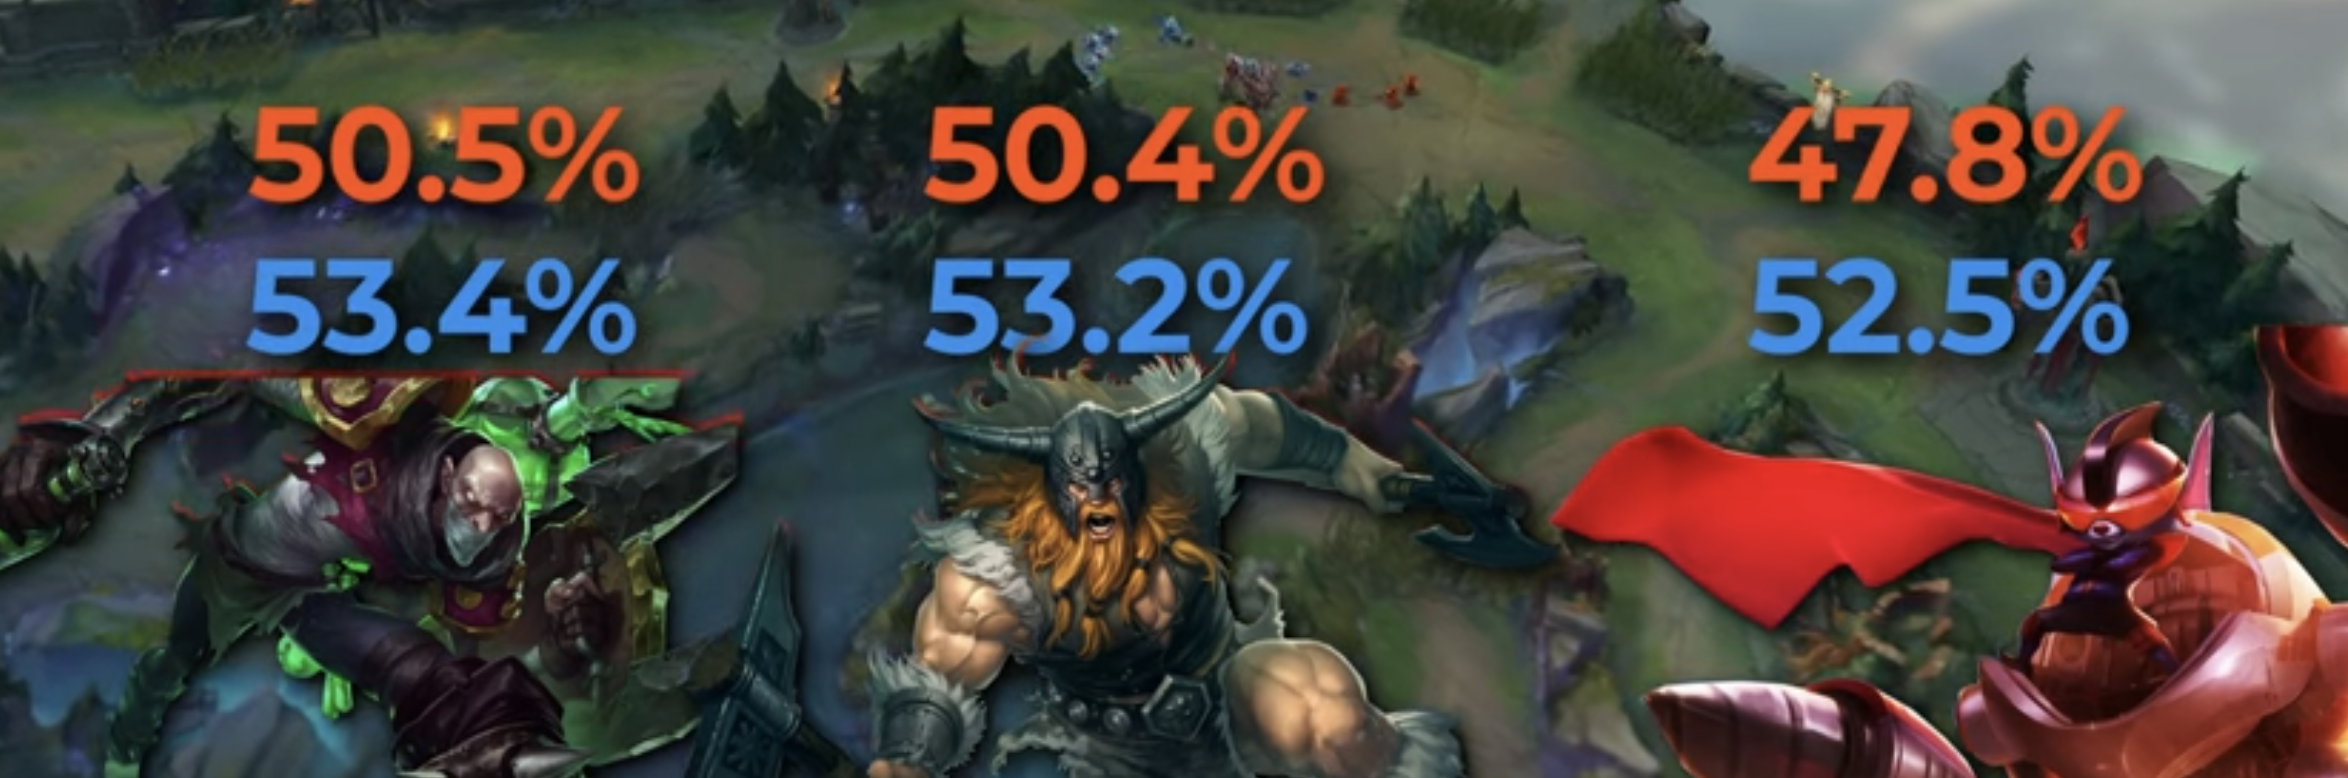
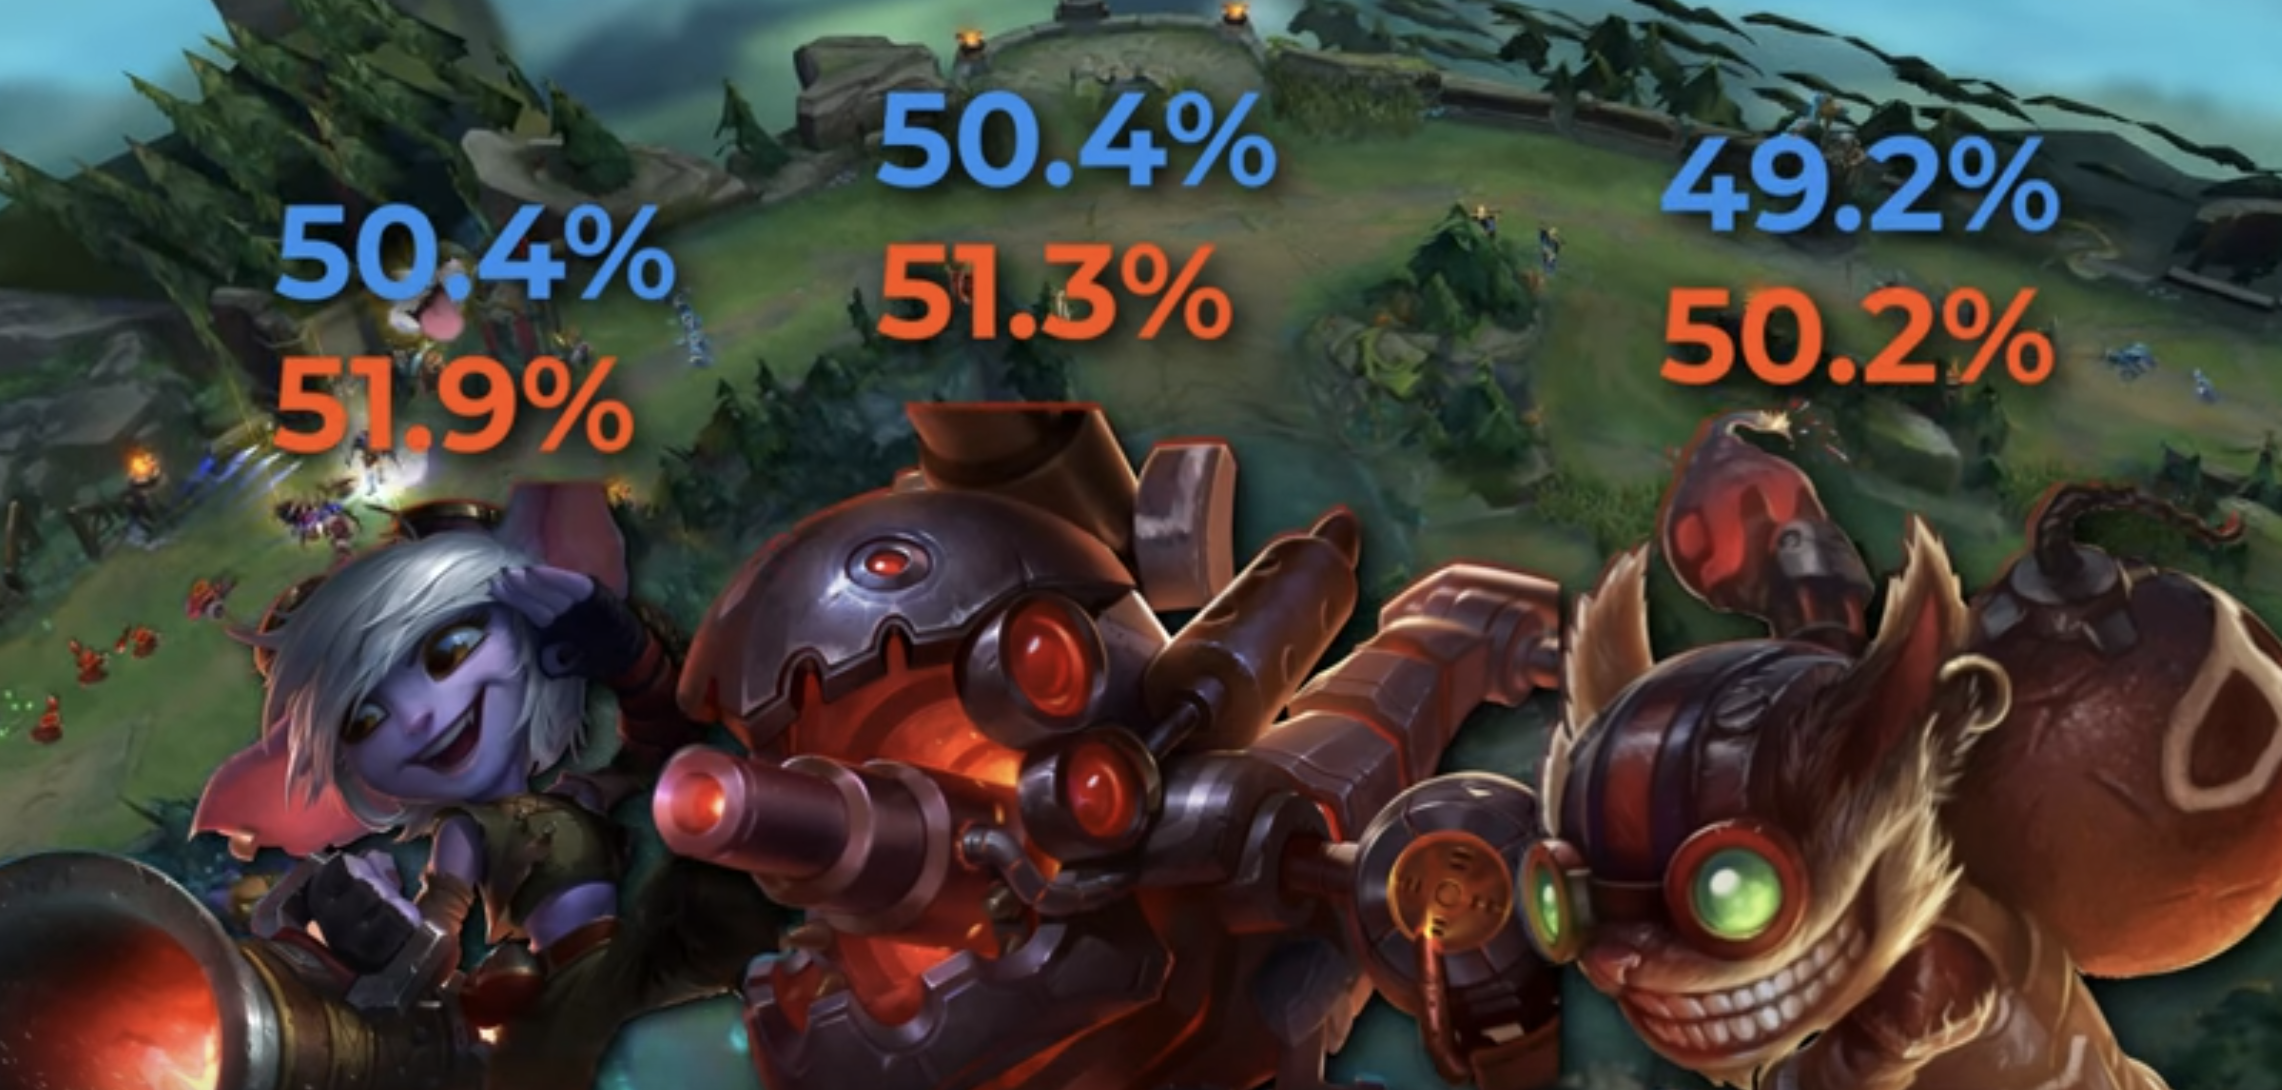
Top lane could have close to ~5% win rate difference based on which side they are playing vs the ~1.5% difference of bot lane.
Plus, the advantages of blue side due to map layout are also within the domain of monster kills.
While the Red side has an advantage to take dragon, there’s a higher chance that an all out fight breaks out due to the fact that more players are in bot lane, and it isn’t uncommon for a support player to ward dragon around spawn timers. This makes taking dragon always a gamble (TP from top lane, bot and mid rotates come in).
However, careful vision control and positioning on the top side could net a jungler sneak heralds pre baron timer with minimal HP if the kiting is done well, which is to be expected at a pro-level. Herald could lead to first tower advantage (also a feature to be considered) and enable early rotations of lanes.
Last but not least, there’s also the aspect of the camera angle, of which the blue side can be referred as the “default” view since tutorials are done in this format, and also the angle creates a trapezium that provides some benefits for blue side viewing angles.
Thus, for teams playing on the red side coming out victorious, they get +5 added to their K-value for playing with a perceived disadvantage
- Gold Difference
This one is pretty straightforward. Gold is the defining currency in the game that is earned through killing minions, getting kills, or objectives. Riot has tons of dashboards that pop up during games that rely on gold-differences to predict a teams win. As such, we are getting the gold difference for the winning team and checking:
- if it’s > 10,000 -> +8 to K-value for dominant performance
- if > 5,000 -> +4 to K-value
- First to objective
The macro level of the game is played contesting objectives. As such, through our data gathering process — the code for which can be found in app/utils.py, we were able to determine which team took:
- First Blood - +2 to K-value
- First Tower - +2 to K-value
- First Dragon - +3 to K-value
- First Herald - +2 to K-value
- First Baron - +4 to K-value
These “first” to objective stats are key to taking gold-advantage. If the winning team is able to take these advantages and convert them to a win, they should be rewarded appropriately for maintaining that gold lead and objective/map control.
- K/D Ratio
The overall teams K/D can be found using total_championsKilled / total_deaths for the team. The K/D represents the right amount of aggression and ability
to take favourable team-fights without dying too much, and as a result, giving away shut-down golds for the advantages the winning team has accomplished.
We deem a K/D of over 1.5 as impressive and deserving of a reward of +5 to the winner K-value.
- Vision Score
Riot defines Vision Score as a stat that indicates how much vision a player has influenced in the game, including the vision they granted and denied. Given this was a player only metric, I’ve aggregated them to create a total for teams. We had access to player wards killed/placed, but the vision score is a metric that already makes sense of that info, so I decided to leverage it.
While this stat varies from game to game, Vision Score is incredibly important for teams at a high-elo/pro-play since that is primarily how they make decisions around the map. I decided to directly reward the teams based on the vision score difference between both the winning and losing side, and divided that value by 10 so the integer value could be added to the K-value without skewing too much.
- Damage dealt to Champions
Similar to Vision Score, the difference in the raw damage being dealt to champions is a good indicator of team-fighting/skirmishing skills. Since this stat also varies game to game, I’ve taken the winning and losing damage difference and divided the value by 10,000 so that the integer value could be added to the K-value without skewing things.
- Game Duration
Finally, the last metric I used to influence K-value is the game-duration. There’s no surrendering in pro-play and according to league-of-graphs, the average game duration for Master+ excluding surrenders is roughly around the ~28-30 min mark.
So, if teams are able to close out a game within:
- 25-30 mins, they get +3 to the K-value
- under 25 mins, +6 to gryffindor… uh, K-value
The shorter game durations imply the team being able to accumulate a lead, capitalize, and close out on it effectively. For that, they shall be rewarded!
Challenges I ran into
Loads! I think I went a little insane, but the dopamine rush of getting some bit of data to make sense is real.
Coming from a full-stack domain, this was my first ML/Data-Science-y project. I was not completely familiar with all the tools available in the toolkit for ML so I had to get accustomed to them over the duration of the hackathon.
I also initially started working on the project thinking that the main goal was to create a ML model that can accurately predict who will win a game as the game progresses live, similar to how Riot uses XGBoost with event data to display those gorgeous graphs throughout live games. Towards the last few days of the hackathon, it clicked that we are just ranking teams so I pivoted to the weighted-K ELO system.
Apart from limited time to work on the project due to a full-time job and an active lifestyle, there were the usual data-problems to tackle
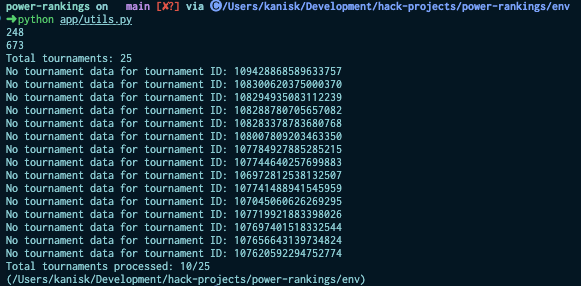
For instance, there were a lot of missing tournaments that were not mapped. We were also working with less data from certain leagues like LPL.
Some tournaments had teams who don’t exist anymore. I could not handle that (for e.g. Worlds 2022 marks Rogue as KOI), but could look into it further with more time.
Tournament data was also unreliable so I had to parse every individual game file for the most accurate information.
For example, look at Game ID: 109517090067719731 from LCS Spring 2023. The first game is between C9 and 100T.
The tournament data suggests that 100T is playing blue side, and C9 is playing red. Blue side ends up losing and red wins — but this is incorrect. The only thing correct in the data was that C9 won the game, but C9 was on blue side, and 100T was on red side as detailed by this actual VOD
This would have rendered our game data mapped to opposite sides and skewed stats for the respective teams, giving 100T 25 kills that game instead of C9! :O
Parsing the giant game data files were definitely a challenge and I’m particularly proud of this binary-search function that finds the nearest event given a timestamp (in my case, 300, 600, 900 and game_end intervals).
There were a lot of places I’ve optimized things to run in O(N) where possible.
The data cleaning and processing afterwards was also difficult and I wanted to gather some features that were mostly set in reality + some fun ones like the OP champs picked etc.
Lastly, due to the time limitations on my end, I did not opt for the API route and instead chose to represent my APIs as methods that can be run using the instructions in the repo.
K-Weighted ELO Rankings
I’m excited to kick back and watch the Worlds 2023 games unravel as I closely keep an eye on how my system’s predictions match up with that of the tournament state!
As of November 4th, 2023: JDG, LNG, BLG, WBG, and T1, all of whom are part of my top 10 ranking teams, are still contending for the top stop in the tournament.
Here are my top 20 teams ranked (rest of the sample outputs of endpoints can be found here):
[
  {
    "ELO": 2046.8577886013984,
    "rank": 1,
    "team_code": "JDG",
    "team_id": "99566404852189289",
    "team_name": "Beijing JDG Intel Esports Club"
  },
  {
    "ELO": 2012.464275432624,
    "rank": 2,
    "team_code": "GEN",
    "team_id": "100205573495116443",
    "team_name": "Gen.G"
  },
  {
    "ELO": 1919.9164734180035,
    "rank": 3,
    "team_code": "LNG",
    "team_id": "99566404850008779",
    "team_name": "Suzhou LNG Esports"
  },
  {
    "ELO": 1860.0579421116825,
    "rank": 4,
    "team_code": "KT",
    "team_id": "99566404579461230",
    "team_name": "kt Rolster"
  },
  {
    "ELO": 1797.700384038097,
    "rank": 5,
    "team_code": "T1",
    "team_id": "98767991853197861",
    "team_name": "T1"
  },
  {
    "ELO": 1791.2709826772032,
    "rank": 6,
    "team_code": "WBG",
    "team_id": "99566404853058754",
    "team_name": "WeiboGaming FAW AUDI"
  },
  {
    "ELO": 1783.7383315561797,
    "rank": 7,
    "team_code": "PSG",
    "team_id": "104367068120825486",
    "team_name": "PSG Talon"
  },
  {
    "ELO": 1776.9631674056816,
    "rank": 8,
    "team_code": "BLG",
    "team_id": "99566404853854212",
    "team_name": "Bilibili Gaming Pingan Bank"
  },
  {
    "ELO": 1717.4995105154403,
    "rank": 9,
    "team_code": "G2",
    "team_id": "98767991926151025",
    "team_name": "G2 Esports"
  },
  {
    "ELO": 1705.8893804033885,
    "rank": 10,
    "team_code": "DFM",
    "team_id": "100285330168091787",
    "team_name": "DetonatioN FocusMe"
  },
  {
    "ELO": 1697.1727279788283,
    "rank": 11,
    "team_code": "LLL",
    "team_id": "105397404796640412",
    "team_name": "LOUD"
  },
  {
    "ELO": 1689.8250085141908,
    "rank": 12,
    "team_code": "HLE",
    "team_id": "100205573496804586",
    "team_name": "Hanwha Life Esports"
  },
  {
    "ELO": 1686.7133742561714,
    "rank": 13,
    "team_code": "CFO",
    "team_id": "107700199633958891",
    "team_name": "CTBC Flying Oyster"
  },
  {
    "ELO": 1672.235368168874,
    "rank": 14,
    "team_code": "IW",
    "team_id": "102235771678061291",
    "team_name": "DenizBank İstanbul Wildcats"
  },
  {
    "ELO": 1665.6980758161203,
    "rank": 15,
    "team_code": "BYG",
    "team_id": "106269804045322803",
    "team_name": "Beyond Gaming"
  },
  {
    "ELO": 1648.0566178067927,
    "rank": 16,
    "team_code": "NRG",
    "team_id": "106972778172351142",
    "team_name": "NRG"
  },
  {
    "ELO": 1646.124131875014,
    "rank": 17,
    "team_code": "R7",
    "team_id": "98767991935149427",
    "team_name": "Movistar R7"
  },
  {
    "ELO": 1645.733235922413,
    "rank": 18,
    "team_code": "FPX",
    "team_id": "99566404855553726",
    "team_name": "FunPlus Phoenix"
  },
  {
    "ELO": 1643.4549312778274,
    "rank": 19,
    "team_code": "TES",
    "team_id": "99566404854685458",
    "team_name": "TOP ESPORTS"
  },
  {
    "ELO": 1639.248068541459,
    "rank": 20,
    "team_code": "IG",
    "team_id": "99566404848691211",
    "team_name": "Invictus Gaming"
  }
]